A dive into COVID data.
One thing very frustrating to me about the current political climate is that those who have sold out to politics view all data through that lens. When it comes to COVID-19, that means “sold out” Republicans see only that data that minimizes the impact of the virus. And “sold out” Democrats only see or retain data that affirms their view that COVID is cataclysmic and is the fault of Republican leadership. Guess what? There is a ton of data out there which is contrary, textured, conflicting and nuanced. And since I’m neither an R or a D, the scales aren’t covering up my eyes when it comes to this rich, fascinating (and obviously sad and sometimes scary) data.
The point of this piece will to find examples of data that isn’t fitting one narrative, but that has caught my eye. Some of it (like “Manic Tuesdays”) will not really really be supportive of either side (doesn’t sound ridiculous when talking about a pandemic?) but will simply be informative.
I will do my best to include source material on everything I post. If you see a source that is questionable or an error I have made, PLEASE let me know so I can correct it. Hopefully, if something “on one hand” rubs you wrong, what’s “on the other hand” will be comforting.
Just another Manic Tuesday ….
One key thing to remember is that statistics are reported unevenly through the week. Nate Silver of fivethirtyeight.com has done a good job pointing this out. Day-to-day comparisons (“deaths were up Tuesday over Monday) are useless because weekend reporting is not as complete. You can see from this chart below, taken from https://www.worldometers.info/coronavirus/country/us/ that there are 5 days of higher reports, then two days of lower. In fact, Tuesdays tend to be the highest reporting days because of weekend “catchup.” CONCLUSION: Don’t get overly excited when weekend/Monday number or low, or overly concerned if Tuesday numbers are high. The best way to compare is week over week (this Monday over last Monday).

Florida cases vs. hospitalizations
The increase in Florida cases has clearly been marked and alarming. I understand that there should be some delay between a soaring case count and fatalities. What is less clear to me is why hospitalizations have not ramped up — at least on a statewide basis — since the increase in cases.
One site I’ve been checking is this AHCA spreadsheet showing ICU bed vacancy. When I first started it checking it, a week or two ago, the vacancy rate was 19 percent.
This is a screengrab from the morning of July 6 (when I wrote this section).
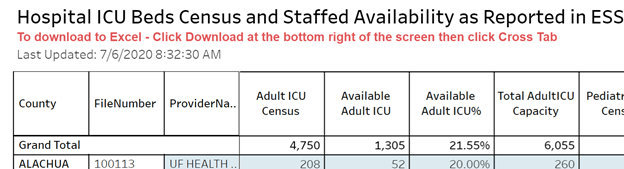
You can see that the ICU bed availability is 21.55% — in other words, it hasn’t gone up since the surge in cases. Over the past few days that number has fluctuated from between 19 and 22 percent.
For context, when I asked TMH CEO Mark O’Bryant what the typical ICU vacancy was in NON-pandemic times, he said 20-30 percent. So, right now, we are within that range (barely). Here is the link to that conversation, which is worth your time. The discussion of typical ICU availability starts at the 17-minute mark.
Going to school on schools
The announcement by Education Commissioner Richard Corcoran that all Florida schools were to reopen in August was quite a shock, to me at least.
But the issue of what to do about opening schools has been hotly debated among epidemiologists, pediatricians, educators, politicians and more, for many weeks.
Last week, to surprisingly little fanfare, the American Academy of Pediatrics issued a position calling for all American schools to reopen.
From the statement: “The AAP strongly advocates that all policy considerations for the coming school year should start with a goal of having students physically present in school,” reads the guidance. “The importance of in-person learning is well-documented, and there is already evidence of the negative impacts on children because of school closures in the spring of 2020.”
Other European countries have already opened schools — Denmark, Austria and Germany to name a few.
There have been a number of studies finding children are not affected by COVID at near the level of adults and especially the elderly population.
Here are a few:
Study: Children half as likely to be affected (Washington Post)
French study: School children don’t spread COVID (Bloomberg)
Netherlands study: Children don’t spread COVID (Netherlands National Institute for Public Health)
(Interesting quote from the Netherlands study: “Based on source and contact tracing from the beginning of the epidemic, we see the following: looking at 10 COVID-19 patients who were <18 years old, they had 43 close contacts, and none of them became ill, whereas 8.3% (55/566) of the close contacts of the 221 patients who were ≥18 years old became ill. Now that widespread source and contact tracing is ramping up again, we will be able to update this information with recent data in summer”)
One thing to keep in mind is that, statistically speaking, children are simply not dying of COVID.
Here is a chart as of a couple weeks ago, for the entire U.S., from the CDC:
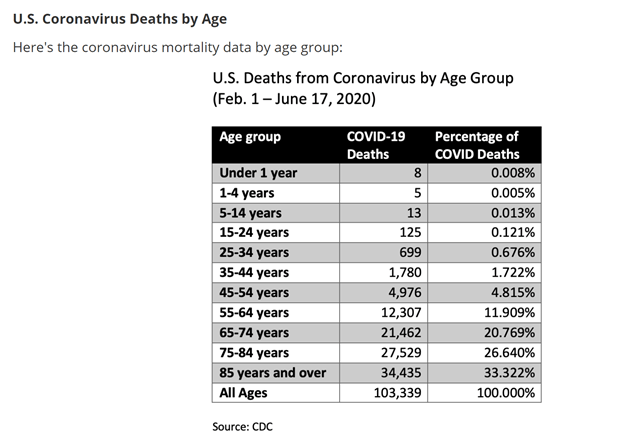
To put those 26 deaths in perspective, If you look at “all cause mortality,” about 9,300 people ages 14 and under die in a year in the U.S. (most recent data I found on this was 2017, below). Causes like accidental drowning, car crashes and the like far dwarf the threat of COVID to children.

Now, that’s not to say there is no threat (aka “on the other hand”). You may have heard of the mysterious illness in New York and other places that was thought to be COVID related that targeted children. To be honest, there hasn’t been much recent reporting on this — I’m not sure why.
Here is a story from five days ago on some new cases emerging, taking the total number to 300. (WBRC)
Here is a story from a few weeks ago on a Boston Children’s Hospital study on the disease (WBUR)
A big issue with regards to going back to school is the threat to teachers.
One issue is that teachers are often in vulnerable age groups (U.S. News and World Report)
I have not been able to find any studies that show what risk teachers face from school reopening — if you can find one, please share.
The clearest danger
Let’s make no mistake, the most vulnerable populations are the elderly and those with medical conditions (particularly lung issues) that COVID attacks.
Let’s go back to the chart I referenced above:
A staggering 80 percent of COVID deaths come from people over the age of 65.
I’m not that smart, but it seems to me that our society should be laser focused on protecting folks in that age group.
OK, I’m going to stop here. I will probably do a part 2 to this, but want to publish this before what I’ve written is outdated. Hope you find this useful. Please leave comments with questions. And don’t forget to subscribe!

Good to see something not tainted by a political lens. Thanks, Skip!
LikeLike
DOH reports daily on the mysterious disease you mentioned, which is called MIS-C. To date, there have been 13 cases in Florida, with most of them located in South FL. You can find a running line list on page two of the pediatric report: http://ww11.doh.state.fl.us/comm/_partners/covid19_report_archive/pediatric_report_latest.pdf
LikeLike